
Description
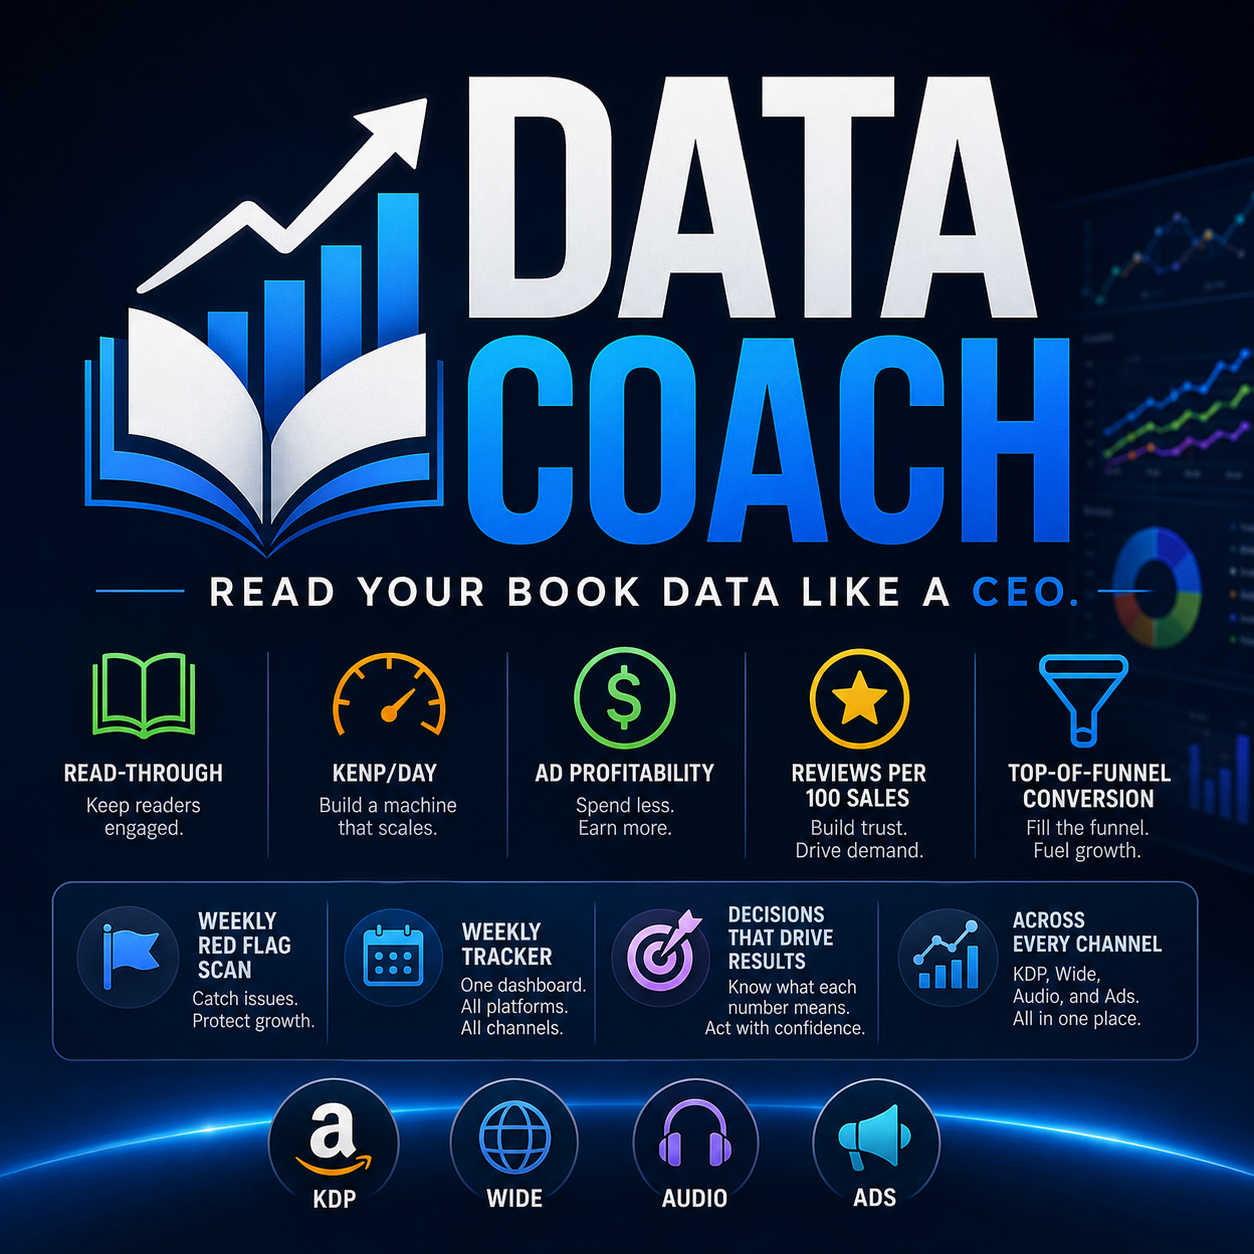
Read your book data like a CEO.
You’ve got data coming out of your ears. KDP. Draft2Digital. ACX. Findaway. Spotify for Authors. YouTube Studio. Book Report. Publisher Rocket. K-lytics. Ad dashboards. Tiny green arrows, tiny red arrows. And you still don’t know if your business is actually growing.
You check your royalties. You see a number. You compare it vaguely to last month. You feel either “that seems fine” or “that seems bad” and move on.
That is not how a CEO runs a business.
A CEO opens any dashboard – ebook, audiobook, ads, wide platform – and within 60 seconds knows: what’s working, what’s dying, and what decision needs to be made this week.
That’s what Data Coach delivers – every Monday, on autopilot.
The Five KPIs Every Indie Author Must Track
Data Coach calculates all five of them automatically, every time you run it:
- Read-through rate – the single most important number for series authors. Calculated per series pair (book 1 -> 2, 2 -> 3, etc.), in ebook AND audio.
- KENP / page reads / listens per book per day – the algorithm visibility signal. When this drops, the book is dying. Data Coach catches it early.
- Ad profitability – ACOS, cost-per-read, CPA. Are your ads paying for themselves? Calculated per platform with the right thresholds for each (KDP sales vs. KU pages vs. Facebook).
- Reviews per 100 sales – the quality and visibility signal most authors ignore. Below 0.3? There’s a real problem. Above 1.0? Healthy.
- Top-of-funnel conversion – click-through and product-page conversion across whichever platform you use.
The 7-Point Red Flag Scan
Every Monday, Data Coach runs a binary scan against your whole catalog and tells you which books need attention this week. Nothing else. No filler. No “everything looks great!” when something is actually slipping.
- Series Pipeline Break – read-through below 50%? Stop writing book 4, fix book 1.
- Algorithm Drop-Off – KENP/day down 25% or more? Investigate before the algorithm forgets the book exists.
- Ad Bleed – ACOS or cost-per-read above the profitable threshold for 3+ days? Pause, diagnose, restart.
- Review Stall – reviews-per-100-sales below 0.3 on a book older than 30 days? Check the back-matter CTA and the cover-blurb match.
- Cover/Blurb Mismatch – product-page conversion below 4% on normal traffic? Fix the page before scaling spend.
- New Release Failure to Launch – release older than 30 days with declining KENP and zero ad lift? Run the revival playbook.
- Read-Through Cliff – week-over-week drop greater than 10 percentage points? Find what changed.
The Book Data Weekly Tracker
Built automatically on your first run. Updated automatically on every run after.
- One row per book, one tab per KPI
- Conditional formatting (green / amber / red) on the flag columns
- Rolling 4-week comparison so you can see what’s moving
- Cut / Monitor / Double Down classification per series
- Red Flag Log with action history
- Works for KDP, KU, wide retailers, audio – all on the same tracker
Genre-Aware Benchmarks
A 1,200 KENP/day book is healthy in cozy mystery and dying in dark romance. Data Coach uses subgenre-specific benchmarks for:
- Contemporary, Dark, Paranormal, Romantasy, MM, Romcom, Clean Romance
- Cozy Mystery, Police Procedural, Psychological Thriller, Romantic Suspense, Vigilante Thriller, Horror
- Epic Fantasy, Space Opera, Urban Fantasy, LitRPG, Cozy Fantasy, Hard Sci-Fi, Cyberpunk
- Western, Christian Romance, Literary Fiction, YA
- Audiobook (cross-genre baseline)
After 90 days of clean data in the tracker, Data Coach replaces industry benchmarks with the author’s own catalog median.
What You Upload
Whatever you have. Data Coach parses:
- KDP Royalties Estimator (XLSX)
- KDP Sales Dashboard (CSV)
- Book Report export (CSV) – strongly recommended for KDP-focused authors
- ACX dashboard export
- Findaway Voices sales report
- Draft2Digital sales export
- Kobo Writing Life CSV
- Apple Books for Authors TSV
- Amazon Ads Console reports (Sponsored Products / Brands)
- Facebook / Meta Ads Manager export
- BookBub Partners export
You don’t need all of them. You need any of them. The plugin works with what you have and tells you what’s missing.
What It Delivers Every Week
- CEO Brief.docx – one page. This week’s flags. What changed. The three decisions worth your time. Cut/Monitor/Double Down per series.
- Book Data Weekly Tracker.xlsx – your full dashboard, updated
- Red Flag Report.md – terse list of every flag triggered
What This Plugin Is Not
It’s not a bookkeeper. It doesn’t log into your accounts. It doesn’t tell you whether your business is “good enough.” It tells you which decisions are owed this week.
If you already track 15 metrics on your own pivot tables, you’ll find Data Coach redundant. If you open KDP, see a royalty number, feel vaguely good or vaguely bad, and close the tab – this is the plugin you’ve been needing.
What’s Inside
- One Claude Code plugin file (.plugin)
- Three slash commands: /data-setup, /data-coach, /red-flag-scan
- Full reference library: five-KPIs guide, red flag checklist, decision tree, genre benchmarks, platform data sources, parser guide
- Eight platform-specific data parsers with permissive header matching
- Tracker builder + reader scripts (Python, runs inside the plugin)
- Installation guide PDF
How to Use It
- Install the plugin (one-time)
- Run
/data-setuponce to build your tracker - Every Monday: run
/red-flag-scanfor a 5-minute check, or/data-coachfor the full weekly report - Open the CEO Brief, do the three things on it, close the tab
Revenue goes up and down. Genres cool off. Platforms change. The skill of looking at your numbers and knowing what to do next? That never stops paying dividends.
VIP members of the AI Writing Easy AF for Authors community get every plugin — including this one — included with their membership, plus access to all plugins 30 days before release day. →


Reviews
There are no reviews yet.